MongoDB Pagenation 성능 개선을 위한 전략
이 글은 2023년 10월 Velog에 작성했던 글 입니다
조사 계기
Mongo Data Repository 학습 중, Pagenation 과정에서 aggregation이 들어가는 것을 발견했다.
1
Page<Article> findByTitle(String title, Pageable pageable);
- 위와 같이 페이지네이션 하는 쿼리에 대해
1
2
3
4
5
2023-10-04 16:52:31.518 DEBUG [traceId=] [http-nio-8080-exec-5] [org.mongodb.driver.protocol.command] - Command "find" started on database db2 using a connection with driver-generated ID 5 and server-generated ID 175 to localhost:27017. The request ID is 34. Command: {"find": "ARTICLE", "filter": {"title": "test1"}, "skip": 5, "limit": 5, "$db": "db2", "lsid": {"id": {"$binary": {"base64": "glOjvC1KR2KhRAZ0KBUCUQ==", "subType": "04"}}}}
2023-10-04 16:52:31.520 DEBUG [traceId=] [http-nio-8080-exec-5] [org.mongodb.driver.protocol.command] - Command "find" succeeded in 1.73 ms using a connection with driver-generated ID 5 and server-generated ID 175 to localhost:27017. The request ID is 34. Command reply: {"cursor": {"firstBatch": [{"_id": {"$oid": "651cfd23f2c1973588c10daa"}, "user_id": {"$oid": "65128e21a1bfc75f7db6a2a1"}, "title": "test1", "content": "c1"}, {"_id": {"$oid": "651cfd24f2c1973588c10dab"}, "user_id": {"$oid": "65128e21a1bfc75f7db6a2a1"}, "title": "test1", "content": "c1"}, {"_id": {"$oid": "651cfd24f2c1973588c10dac"}, "user_id": {"$oid": "65128e21a1bfc75f7db6a2a1"}, "title": "test1", "content": "c1"}, {"_id": {"$oid": "651cfd25f2c1973588c10dad"}, "user_id": {"$oid": "65128e21a1bfc75f7db6a2a1"}, "title": "test1", "content": "c1"}, {"_id": {"$oid": "651cfd26f2c1973588c10dae"}, "user_id": {"$oid": "65128e21a1bfc75f7db6a2a1"}, "title": "test1", "content": "c1"}], "id": 0, "ns": "db2.ARTICLE"}, "ok": 1.0}
2023-10-04 16:52:31.520 DEBUG [traceId=] [http-nio-8080-exec-5] [org.mongodb.driver.operation] - Received batch of 5 documents with cursorId 0 from server localhost:27017
2023-10-04 16:52:31.520 DEBUG [traceId=] [http-nio-8080-exec-5] [o.s.data.mongodb.core.MongoTemplate] - Executing count: { "title" : "test1"} in collection: ARTICLE
2023-10-04 16:52:31.521 DEBUG [traceId=] [http-nio-8080-exec-5] [org.mongodb.driver.protocol.command] - Command "aggregate" started on database db2 using a connection with driver-generated ID 5 and server-generated ID 175 to localhost:27017. The request ID is 35. Command: {"aggregate": "ARTICLE", "pipeline": [{"$match": {"title": "test1"}}, {"$group": {"_id": 1, "n": {"$sum": 1}}}], "cursor": {}, "$db": "db2", "lsid": {"id": {"$binary": {"base64": "glOjvC1KR2KhRAZ0KBUCUQ==", "subType": "04"}}}}
- skip & limit query 이후에 aggregation을 이용한 count 쿼리가 들어가는 것을 확인했다.
공식 도큐먼트는 아니지만(ㅎㅠ) stackoverflow의 한 답변에 의하면, aggregation을 이용한 count 쿼리가 .count를 이용한 count쿼리보다 성능이 좋지 않은 것으로 테스트 된 것을 인 할 수 있었다. MongoDB Count() vs. Aggregation
요약
- aggregation : 43838.8 밀리초
- count : 0.6 밀리초
MongoDataRepository에서 공식 지원하는 페이지네이션 외에, 성능 개선할 수 있는 방법이 무엇이 있을지 조사했다.
불필요한 count를 줄여주는 Slice 방법과, $gt + limit을 이용하여 읽는 데이터 레코드 수를 줄여주는 방식이 있었다. 상황에 따라 두 방식을 적절히 사용하면 되겠다.
1. Slice
Pagenation기능에서 totalPage를 제외한 쿼리. 총 데이터 수(페이지 마지막장)는 알 수 없지만, 기본적인 skip/limit을 통한 페이지네이션은 제공하는 기법이다.
1
Slice<Article> findByTitle(String title, Pageable pageable);
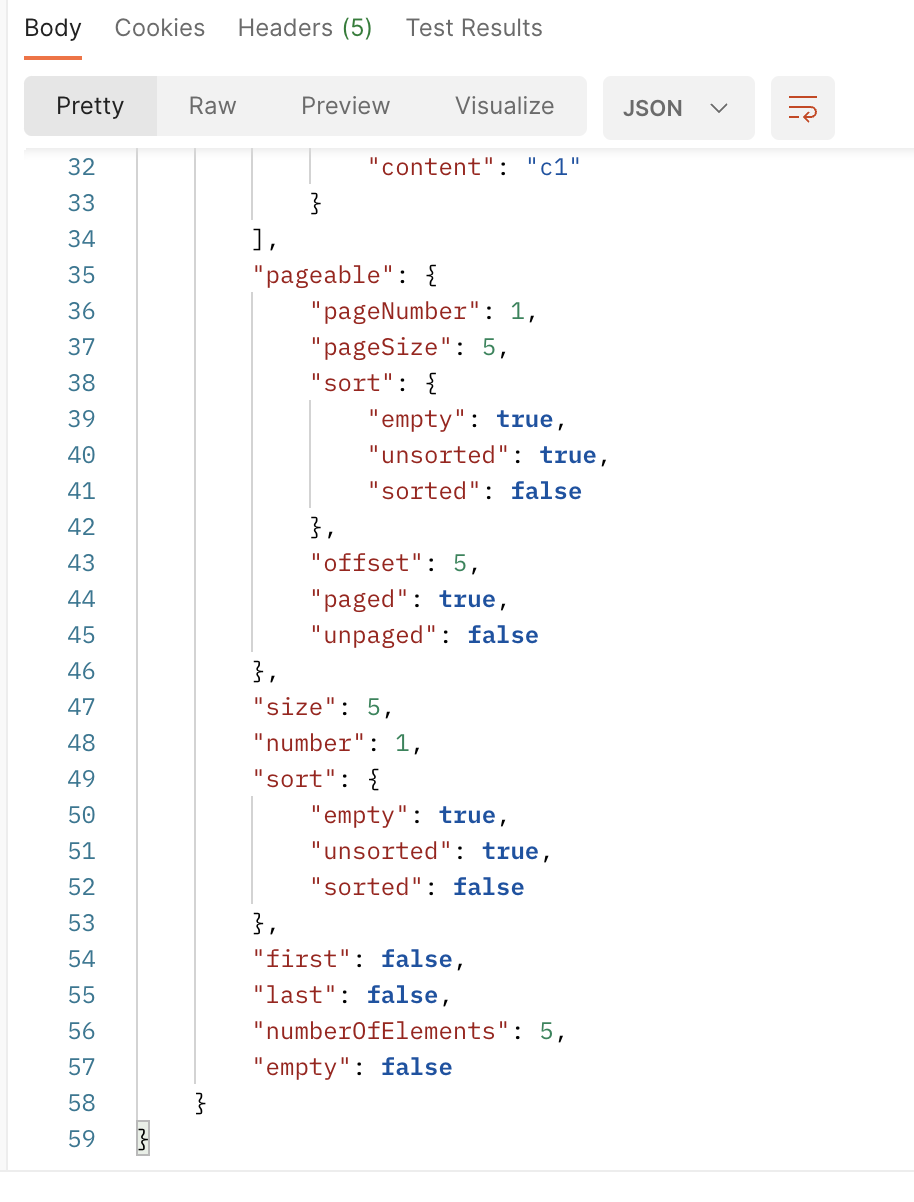
위 메서드를 실행한 결과, 아래와같이 cnt 쿼리는 따로 실행되지 않는 것을 확인할 수 있었다.
1
2023-10-04 17:54:30.901 DEBUG [traceId=] [http-nio-8080-exec-1] [org.mongodb.driver.protocol.command] - Command "find" started on database db2 using a connection with driver-generated ID 5 and server-generated ID 224 to localhost:27017. The request ID is 9. Command: {"find": "ARTICLE", "filter": {"title": "test1"}, "skip": 5, "limit": 6, "$db": "db2", "lsid": {"id": {"$binary": {"base64": "e2fA6a2RRU26QA6QRQJmEQ==", "subType": "04"}}}}
다만 totalPage가 표기되지 않는 것도 확인할 수 있었다
| Slice | Page |
|---|---|
 |  |
SNS 피드와 같이 total page가 필요하지 않는 경우에는 Slice를 사용하는것이 효율적이다.
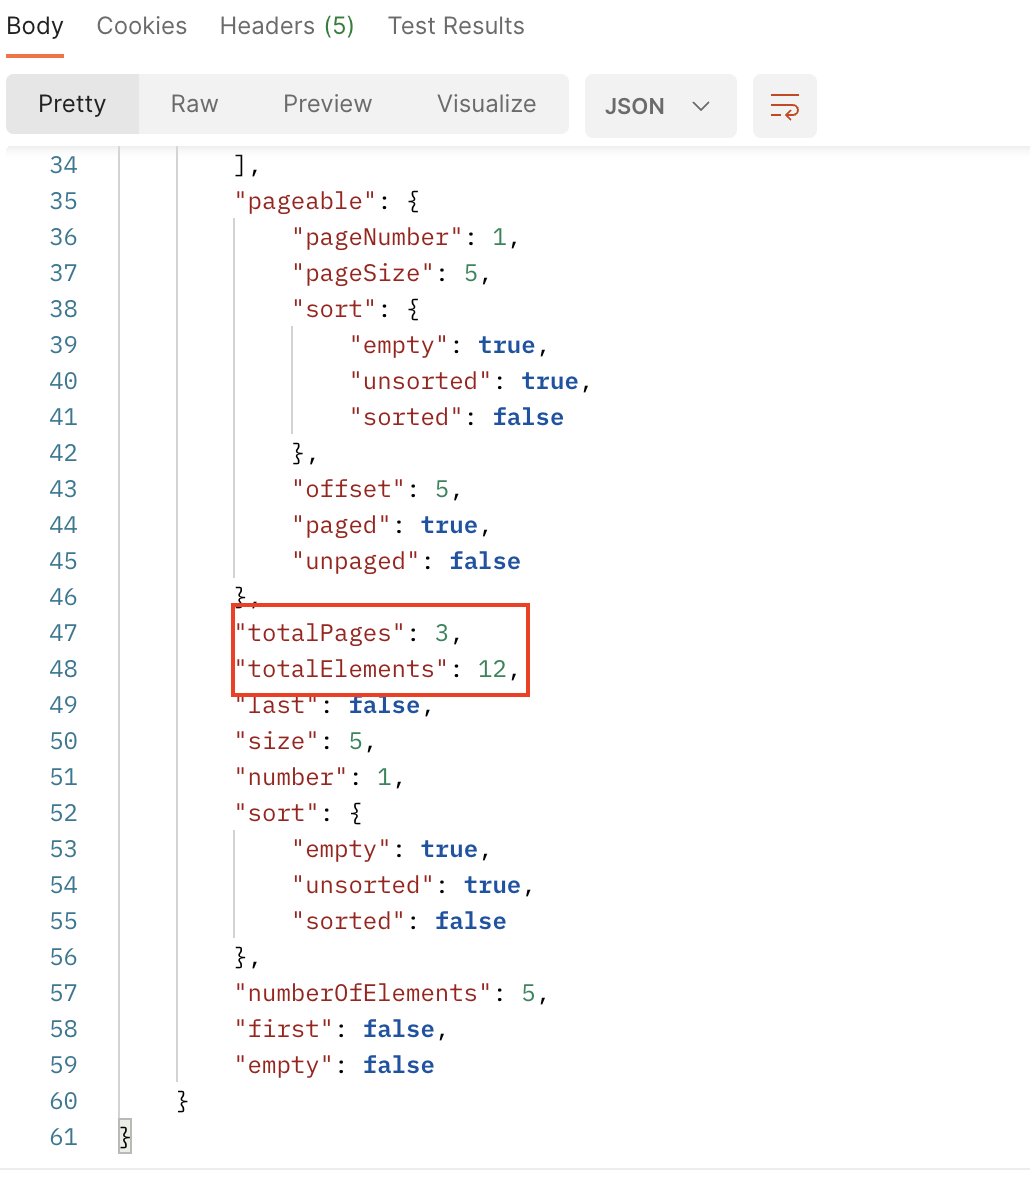
그렇다면 total page가 꼭 필요한 상황에서는 어떻게 해야 할까? 결론적으로는 그냥 Page 를 사용하는 것이 낫다. Mongo Data Repository에서는 어떤 방식으로 쿼리를 해도 count는 aggregation을 하는 것을 확인할 수 있었다…
count 시 aggregation을 사용하지 않기 위해, count 쿼리를 따로 실행하고, Slice를 Page로 변환하며 cnt를 추가하고자 시도했었다.
1
2
3
4
5
6
7
8
9
10
11
12
13
14
15
16
17
18
19
20
21
22
23
24
25
26
27
28
29
30
31
32
public ArticleGetResult get(ArticleGetDto articleGetDto, Pageable pageable) {
    Slice<Article> articles;
    long cnt = 0L;

    if (articleGetDto.getKey().equals("title")) {
        articles = articleRepository.findByTitle(articleGetDto.getValue(), pageable);
        cnt = articleRepository.countByTitle(articleGetDto.getValue());
    } else if (articleGetDto.getKey().equals("content")) {
        articles = articleRepository.findByContentLike(articleGetDto.getValue(), pageable);
        cnt = articleRepository.countByContentLike(articleGetDto.getValue());
    } else {
        articles = articleRepository.findArticles(pageable);
        cnt = articleRepository.count();
    }

    List<ObjectId> userIds = articles.stream().map(Article::getUserId).collect(Collectors.toList());
    List<User> userList = userRepository.findByIdIn(userIds);

    List<ArticleGetResult.ArticleData> data = articles.map(article -> {
        User user = userList.stream().filter(user1 -> user1.getId().equals(article.getUserId())).findFirst().orElseThrow();
        return ArticleGetResult.ArticleData.builder()
                .id(article.getId().toString())
                .userName(user.getName())
                .title(article.getTitle())
                .content(article.getContent())
                .build();
    }).stream().toList();

    Page<ArticleGetResult.ArticleData> pagedata = new PageImpl<>(data, pageable, cnt);

    return ArticleGetResult.builder().data(pagedata).build();
}
위와 같은 코드에서, countByTitle하는 부분을 아래 세 레포지토리로 시도를 해 보았다.
1
2
3
4
5
6
7
@CountQuery("{title :  ?0}")
Long countByTitle(String title);

@Query(count = true)
Long countByTitle(String title);

Long countByTitle(String title);
결과는 세 메서드 다 동일하게, aggregation을 사용하여 count를 하는 것을 확인할 수 있었다.
1
2
2023-10-04 17:54:30.934 DEBUG [traceId=] [http-nio-8080-exec-1] [o.s.data.mongodb.core.MongoTemplate] - Executing count: { "title" : "test1"} in collection: ARTICLE
2023-10-04 17:54:30.939 DEBUG [traceId=] [http-nio-8080-exec-1] [org.mongodb.driver.protocol.command] - Command "aggregate" started on database db2 using a connection with driver-generated ID 5 and server-generated ID 224 to localhost:27017. The request ID is 10. Command: {"aggregate": "ARTICLE", "pipeline": [{"$match": {"title": "test1"}}, {"$group": {"_id": 1, "n": {"$sum": 1}}}], "cursor": {}, "$db": "db2", "lsid": {"id": {"$binary": {"base64": "e2fA6a2RRU26QA6QRQJmEQ==", "subType": "04"}}}}
2. $gt + limit
쿼리 분석 중 skip을 사용하면 물리적으로 데이터를 건너 뛰는 것이 아니라, skip한만큼의 도큐먼트가 로드된 뒤 출력에서만 제외되는 것을 확인했다. MongoDB의 메모리 버퍼를 통해 실질적인 디스크 접근은 없을 수 있으나, 뒷 페이지로 갈수록 많은 도큐먼트를 읽게 된다는 문제가 있다.
아래는 실행계획 통해 실제로 읽은 도큐먼트를 확인한 것이다.
1
db.getCollection("accounts").find({}).skip(0).limit(20).explain("executionStats")
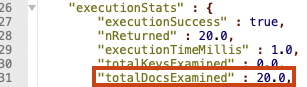
첫 페이지에서는 20개의 도큐먼트만 읽은 것을 확인할 수 있다.
1
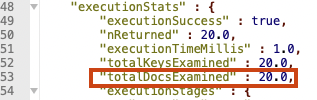
db.getCollection("accounts").find({}).skip(100).limit(20).explain("executionStats")
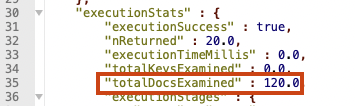
6페이지에서는 120개의 도큐먼트를 읽은 것을 확인 할 수 있다.
skip을 사용하지 않고 $gt + limit 으로 데이터 읽기
이 때 해결 방법으로, .skip을 사용하지 않고 $gt:{} 쿼리와 .limit() 을 이용하여 데이터를 읽는 방법이 있다.
다만 이 때 주의사항이 있다.
- 쿼리는
$gt기준 데이터로 정렬되어 있어야 한다 $gt기준 컬럼은 유니크 해야한다$gt기준 컬럼은 null값이 있어서는 안된다$gt기준 컬럼은 인덱싱 되어 있어야 한다
인덱싱 되어있지 않은 컬럼이면 읽는 과정에서 정렬을 위해 많은 도큐먼트를 읽게 되므로 아예 무의미한 방법이 된다.
따라서 권장하는 방법은 _id 컬럼을 기준 데이터로 하는 것이다. _id 를 디폴트로 사용되는 ObjectId 로 할 경우에도 주의사항이 있다.
ObjcetId는 시간 순서를 반드시 보장하지는 않는다.1
{timestamp(4byte. 1초단위)}{random(8byte)}{counter(3byte)}ObejectId는 위와 같은 구조로 구성되어 있기 때문에, 동일 초에 삽입된 데이터에 대해서는 순서를 보장하지 않는다
본론으로 돌아와, $gt + limit을 통해 데이터를 읽었을 때의 실행계획을 비교해보자.
1
db.getCollection("accounts").find({}).sort({_id:1}).limit(20).explain("executionStats")
첫 페이지를 읽었을 때, 20개의 도큐먼트를 읽은 것을 확인할 수 있었다.
1
2
// 위 쿼리 결과에서의 마지막 데이터의 objectId 기준 gt 조회
db.getCollection("accounts").find({_id:{$gt: ObjectId("5ca4bbc7a2dd94ee58162395")}}).limit(20).explain("executionStats")
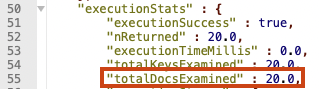
그 다음 페이지를 읽어도 마찬가지로 20건의 데이터를 읽은 것을 확인할 수 있다.
결론
- pk(
_id) 활용을 잘 하자 - total page가 없는 경우에는 Page가 아닌 Slice 자료구조를 사용하자
- 아주 특별한 경우가 아니고서는 $gt 와 limit을 이용하여 페이지네이션 할 수 있도록 개선해보자